

Quick Summary: The fulfillment KPIs worth tracking come down to five: picking and packing rate, labor cost per unit and per order, order accuracy rate, warehouse capacity utilization, and dock-to-stock cycle time. Between them they answer the three questions that decide a 3PL's margin: how fast the work moves, what it costs, and whether it was right. Per the 2025 WERC DC Measures Report, best-in-class operations run 70 or more lines picked and shipped per person per hour, 99.68% order-picking accuracy, 90% or higher average capacity used, and dock-to-stock cycle time under 3.5 hours. Each KPI below comes with its formula, that benchmark, and the report inside Extensiv that produces the number.
Most warehouse metrics fail for the same reason: they get measured without a target, so a number moves and nobody knows whether to act. A KPI earns its place when you can state the formula, name the figure that counts as good, and pull it without building a spreadsheet. This guide gives you all three for five fulfillment KPIs, plus the question those numbers usually get raised to answer: how to take labor cost out of the building without giving back accuracy.
Which KPIs Should You Track to Measure Fulfillment Performance?
Five KPIs cover fulfillment performance: picking and packing rate, labor cost per unit and per order, order accuracy rate, warehouse capacity utilization, and dock-to-stock cycle time. Throughput and cost tell you what the operation produces and what it costs to produce. Accuracy tells you whether it counted. Utilization and dock-to-stock are the two leading indicators, the ones that move before the others do.
The order matters. Accuracy and dock-to-stock start slipping weeks before cost per order rises, because a receiving backlog and a rework queue both consume hours that never show up as production. Read the leading indicators first and the cost metrics stop surprising you.
1. Picking and Packing Rate
Picking and packing rate measures how much work each person completes per hour. It is the productivity denominator underneath every labor cost figure you will calculate later.
Formula. Picking rate = total order lines picked ÷ total picking labor hours. Packing rate = total items packed ÷ total packing labor hours. Keep the two separate. They have different constraints, and blending them hides which station is actually holding up the shift.
Benchmark. The 2025 WERC DC Measures Report puts best-in-class at 70 or more lines picked and shipped per person per hour, as summarized in Yale's top-12 distribution center metrics. Treat that as a ceiling to work toward rather than a universal target, because pick profile drives the number more than effort does: broken-case picking and full-pallet moves are not the same job, and WERC benchmarks them separately. According to Supply Chain Management Review, a warehouse running manual processes averages 4,000 to 5,000 lines per day against 10,000 or more with WMS-directed picking.
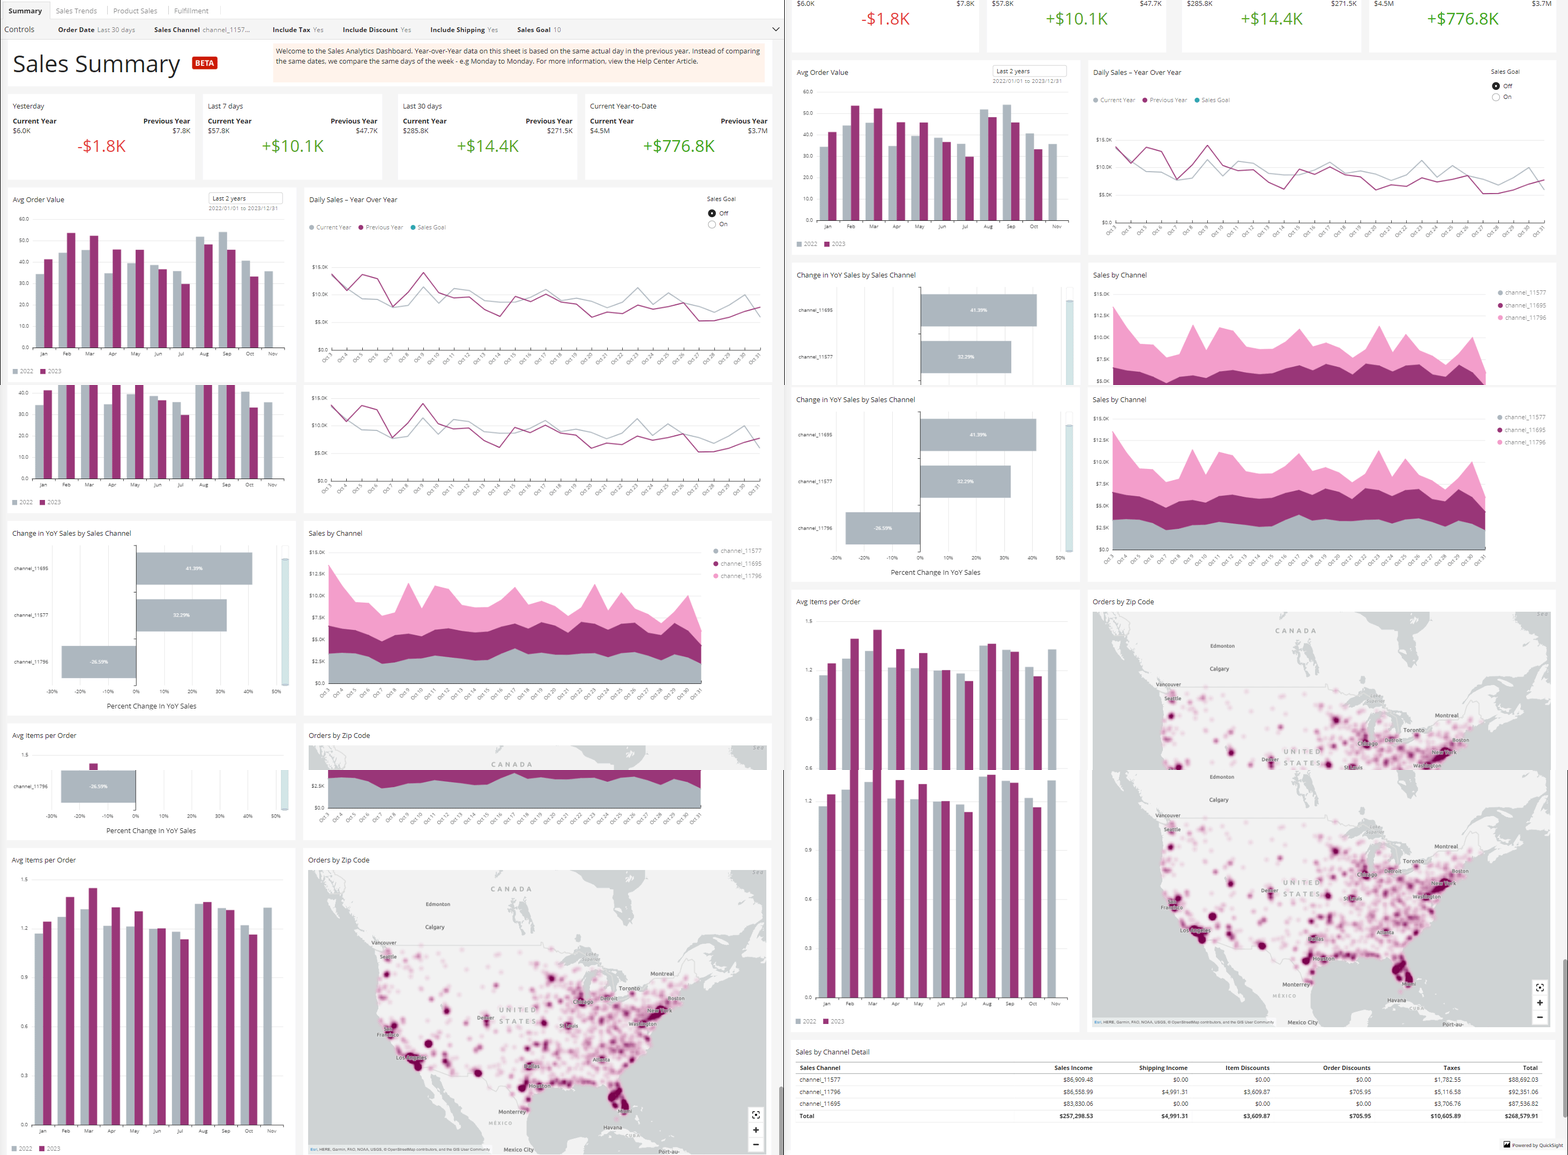
Where it lives in Extensiv. The Warehouse Productivity Dashboard carries this on its Productivity sheet: "Order Lines Picked by Hour" and "Order Items Packed by Hour", each plotted against a Picking Pace Goal you set. "Order Fulfillment Activity Over Past 7 Days" gives you the trailing context, so a slow hour reads as a slow hour instead of a trend. For the metric taxonomy underneath picking, see the 10 picking accuracy metrics 3PLs should track in a WMS.
2. Labor Cost Per Unit and Per Order
Labor cost per unit and per order converts every efficiency change in the building into one comparable number. It is the metric an owner asks about and the one that decides whether a client account is worth keeping at its current rate.
Formula. Labor cost per order = fully loaded labor cost ÷ orders shipped. Labor cost per unit = fully loaded labor cost ÷ units shipped. Fully loaded means wages plus payroll taxes, benefits, temp agency fees, and overtime premium. Leave any of those out and you will understate the cost of the shifts that hurt most.
Benchmark. No credible public dollar benchmark exists for this one, and we would rather say so than repeat a range with nothing behind it. WERC and APQC both track warehouse cost measures, but those figures sit behind paid membership. Two sourced numbers frame it instead. Labor accounts for approximately 65% of total warehouse operating costs, according to research from MHI and Deloitte, which makes it the largest cost line you control. And the 2025 WERC DC Measures Report puts the top tier at overtime under 1.88% of total hours worked, the closest public proxy for labor efficiency. Past those two, your benchmark is your own trailing trend and your per-client spread. A cost per order that climbs while volume stays flat is the signal, whatever the absolute number.
Where it lives in Extensiv. Labor Analytics is the report built for this: individual performance leaderboards, cost to serve, and profitability by client, drawn from the same transactions that direct the work, not from a payroll export. That last part is what makes the number defensible in a rate conversation. Labor analytics explains movements instead of just reporting them, and where volume swings drive your staffing, AI-driven labor forecasting turns that history into next week's plan.
3. Order Accuracy Rate
Order accuracy rate is the share of orders shipped without an error of any kind: wrong item, wrong quantity, wrong address, missing line. It is the KPI your clients experience directly, and the one that turns into an SLA penalty when it slips.
Formula. Order accuracy rate = (orders shipped without error ÷ total orders shipped) × 100. Count honestly. An error caught at pack-out still counts as an error, because catching it consumed labor even though it never reached the customer. If you only count the errors clients complain about, you are tracking their tolerance and calling it your accuracy rate.
Benchmark. The 2025 WERC DC Measures Report puts best-in-class order-picking accuracy at 99.68% or better. The system matters more here than individual effort does: average order fulfillment accuracy runs 99.5% with a WMS against 92% without one, per Aberdeen Group research cited by Supply Chain Dive. Below 99% with a system already in place, the cause is usually process at picking or pack-out rather than the software.
Where it lives in Extensiv. Accuracy is enforced before it is reported. SmartScan validates each scan against the pick job, so a wrong item fails at the handheld instead of at the customer. The Warehouse Productivity Dashboard's Fulfillment Status sheet then surfaces what needs attention today through "Order Status Details" and "Overallocated Orders by Customer", while the Cycle Count report holds the inventory records that accuracy depends on. On the inventory side of the same question, cycle counting is the discipline that keeps inventory accuracy from drifting; companies using an advanced WMS report a 25% improvement in inventory accuracy, according to the MHI Annual Industry Report.
4. Warehouse Capacity Utilization
Warehouse capacity utilization is the percentage of usable storage capacity that inventory actually occupies. For a 3PL it reads two ways at once: an operational congestion measure and a report on how much of your billable capacity is generating invoices.
Formula. Utilization = (occupied storage space ÷ total usable storage space) × 100. Run it on square feet for floor utilization, cubic feet for cube utilization, and storage locations for slot utilization. "Usable" excludes docks, staging, packing, offices, and aisles. Calculating against gross square footage flatters the number and buries the problem.
Benchmark. The 2025 WERC DC Measures Report puts the top tier at 90% or higher average warehouse capacity used, with peak capacity used at 100% or higher. Read the high end carefully. Past roughly 85% average utilization, putaway crews spend longer hunting open locations and receiving slows because product has nowhere to land, so treat the top of the range as a peak allowance rather than a daily target. The gap between your slot and cube numbers is where recoverable space hides: locations that read as full while holding half-empty pallets.
Where it lives in Extensiv. Every input already sits in the system. Locations are defined in 3PL Warehouse Manager, inventory is tracked to the location level in real time across all clients, and item setup captures the dimensions that supply the cube math. Slot utilization comes out of a report, no walk-through required, and the Stock Status report gives you the on-hand picture behind it. Because storage billing draws on the same location data, the operational finding and the invoice evidence arrive together. Ongoing warehouse optimization is what turns that into a weekly habit.
5. Dock-to-Stock Cycle Time
Dock-to-stock cycle time is the elapsed time from a receipt arriving to that inventory being put away and available to pick. Anything sitting on the dock is stock your system says you have and your pickers cannot touch.
Formula. Dock-to-stock = putaway completion timestamp − receipt arrival timestamp, averaged across receipts. Measure from physical arrival, not from when someone opened the receipt in the system. The lag between those two events is often the problem you are looking for.
Benchmark. The 2025 WERC DC Measures Report puts best-in-class dock-to-stock under 3.5 hours. It is also one of the five metrics warehouse professionals track most closely, alongside on-time shipments, average and peak capacity used, and order-picking accuracy, which tells you how much of the industry is watching this number. If yours is measured in days instead of hours, receiving is the cheapest place in the building to find time back.
Where it lives in Extensiv. The Warehouse Productivity Dashboard's Receiving Status sheet is built around this: "Age of Receipts" shows you what is aging right now, "Receipts by Receiving Status" separates an incomplete ASN from a receipt genuinely stuck in putaway, and "Scheduled ASNs" tells you what is inbound before it lands. "Receipt Lines Closed by Hour" gives receiving the same pace view picking gets.
The Five Fulfillment KPIs at a Glance
|
# |
KPI |
Formula |
Best-in-class (WERC 2025) |
Where it lives in Extensiv |
|
1 |
Picking and packing rate |
Lines picked ÷ picking hours |
70+ lines per person per hour |
Warehouse Productivity Dashboard, Productivity sheet |
|
2 |
Labor cost per unit and order |
Fully loaded labor cost ÷ orders or units |
No public dollar benchmark; overtime under 1.88% of hours |
Labor Analytics |
|
3 |
Order accuracy rate |
Error-free orders ÷ total orders |
99.68% or better |
SmartScan validation, Fulfillment Status sheet |
|
4 |
Capacity utilization |
Occupied space ÷ usable space |
90%+ average, 100%+ peak |
Location data, Stock Status report |
|
5 |
Dock-to-stock cycle time |
Putaway time − arrival time |
Under 3.5 hours |
Receiving Status sheet |
How Can You Reduce Warehouse Labor Costs Without Sacrificing Accuracy?
You reduce warehouse labor costs without sacrificing accuracy by attacking travel time instead of task time, and by making the system verify the work instead of asking people to be more careful. Those two moves matter because labor accounts for roughly 65% of warehouse operating costs, and because 42% of supply chain professionals name labor shortages as their top operational challenge, both per research from MHI and Deloitte. Asking a short-staffed crew to move faster is the approach that costs you accuracy.
Here is the thing about the trade-off framing: it is usually a sequencing problem. Each of the three levers below moves a cost metric and an accuracy metric at the same time, and the order you apply them in decides whether the second number helps or hurts.
Slot First, So the Pick Path Gets Shorter
Slotting assigns each SKU a storage location based on how often it is picked and what it sits next to. Move fast movers into prime, easily reached positions and the pick path shortens, which lowers cost per order without anyone working harder.
Slotting also raises accuracy, which is why it goes first. Separating lookalike SKUs across different locations removes the confusion that produces mis-picks in the first place. A warehouse slotting review usually frees prime locations as a side effect, so it pays into your utilization number too.
Then Batch, Because Travel Time Is the Real Cost
Batch picking has one picker collect items for a group of orders in a single pass instead of walking the building once per order. Wave picking releases work in scheduled groups so downstream stations stay fed. Both attack travel time, which is the largest non-productive share of a picker's hour.
This is also the lever that can cost you accuracy. Batching introduces a sort step: multiple orders' items travel together and have to be separated correctly at the pack station. Batch without verification at that sort and you convert saved travel time into mis-ships. The comparison between wave picking and batch picking comes down to order profile and how much your pack stations can absorb.
Let Scanning Hold the Line
Scanning is what makes the first two levers safe. When the handheld validates each item against the pick job, a wrong item fails at the point of the pick, not at the customer, and the sort step batching introduced stops being a risk you are carrying.
Scanning does add a few seconds per line, and that shows up in your picking rate. It buys back more than it costs: the accuracy difference between WMS-directed and manual operations is 99.5% against 92%, per Aberdeen Group research cited by Supply Chain Dive, and every avoided error removes a rework cycle that would have consumed labor twice. Our complete guide to barcode scanning for 3PL warehouses covers the setup detail.
Review Each Cost Metric With Its Accuracy Counterpart
None of this works if you report the cost metric on its own. Pair every labor initiative with its accuracy counterpart and review them together: picking rate next to order accuracy, cost per order next to rework volume, overtime percentage next to dock-to-stock. When cost falls and the paired accuracy number holds, the gain is real. When cost falls and accuracy drifts, you moved the expense into rework and returns instead of removing it.
Averitt Express did exactly this. With data guiding staffing decisions through Labor Analytics, Averitt reports 18 to 20% labor savings from pure efficiency gains, per Ed Smith, VP of Distribution and Fulfillment. They scaled from a handful of sites to roughly 300 customers on the WMS over the same stretch and took a 2025 Quest for Quality award in distribution and fulfillment. Those savings came from staffing precision, not from asking anyone to hurry.
Read Every KPI Twice If You Run Multiple Clients
A single-brand warehouse reads these five numbers once. A 3PL reads them twice: once for the building and once per client. Order accuracy of 99.4% across the building can hide a 97% month for your newest account, and that client experiences only their own number.
The same doubling applies to labor cost per order, where the per-client view is the difference between knowing the operation is profitable and knowing which accounts make it so. Multi-client separation has to be native to how the data is captured, not applied afterward with a filter, or the per-client view becomes a monthly rebuild nobody sustains. Extensiv 3PL Warehouse Manager's reports and dashboards carry both views from the same records.
Frequently Asked Questions
Put the Five on One Screen
Fulfillment KPIs earn their place when each one carries a formula, a benchmark, and a source you trust. Five is enough to cover throughput, cost, accuracy, space, and receiving, and few enough that the roster actually gets read at shift start. The leverage is in pairing the cost numbers with their accuracy counterparts, reading each one per client as well as building-wide, and pulling all of it from the system that directs the work instead of from exports that go stale the first busy week.
See how Extensiv 3PL Warehouse Manager reports these five across every client from one set of records: request a demo.
-
You’ll read about:

Be the first to know
Subscribe to our newsletter